Favour thinking with metrics: behaviour and money
The main activity in digital product is not lying to yourself: behavioural metrics, our relationship with money, and unit economics as a compass.
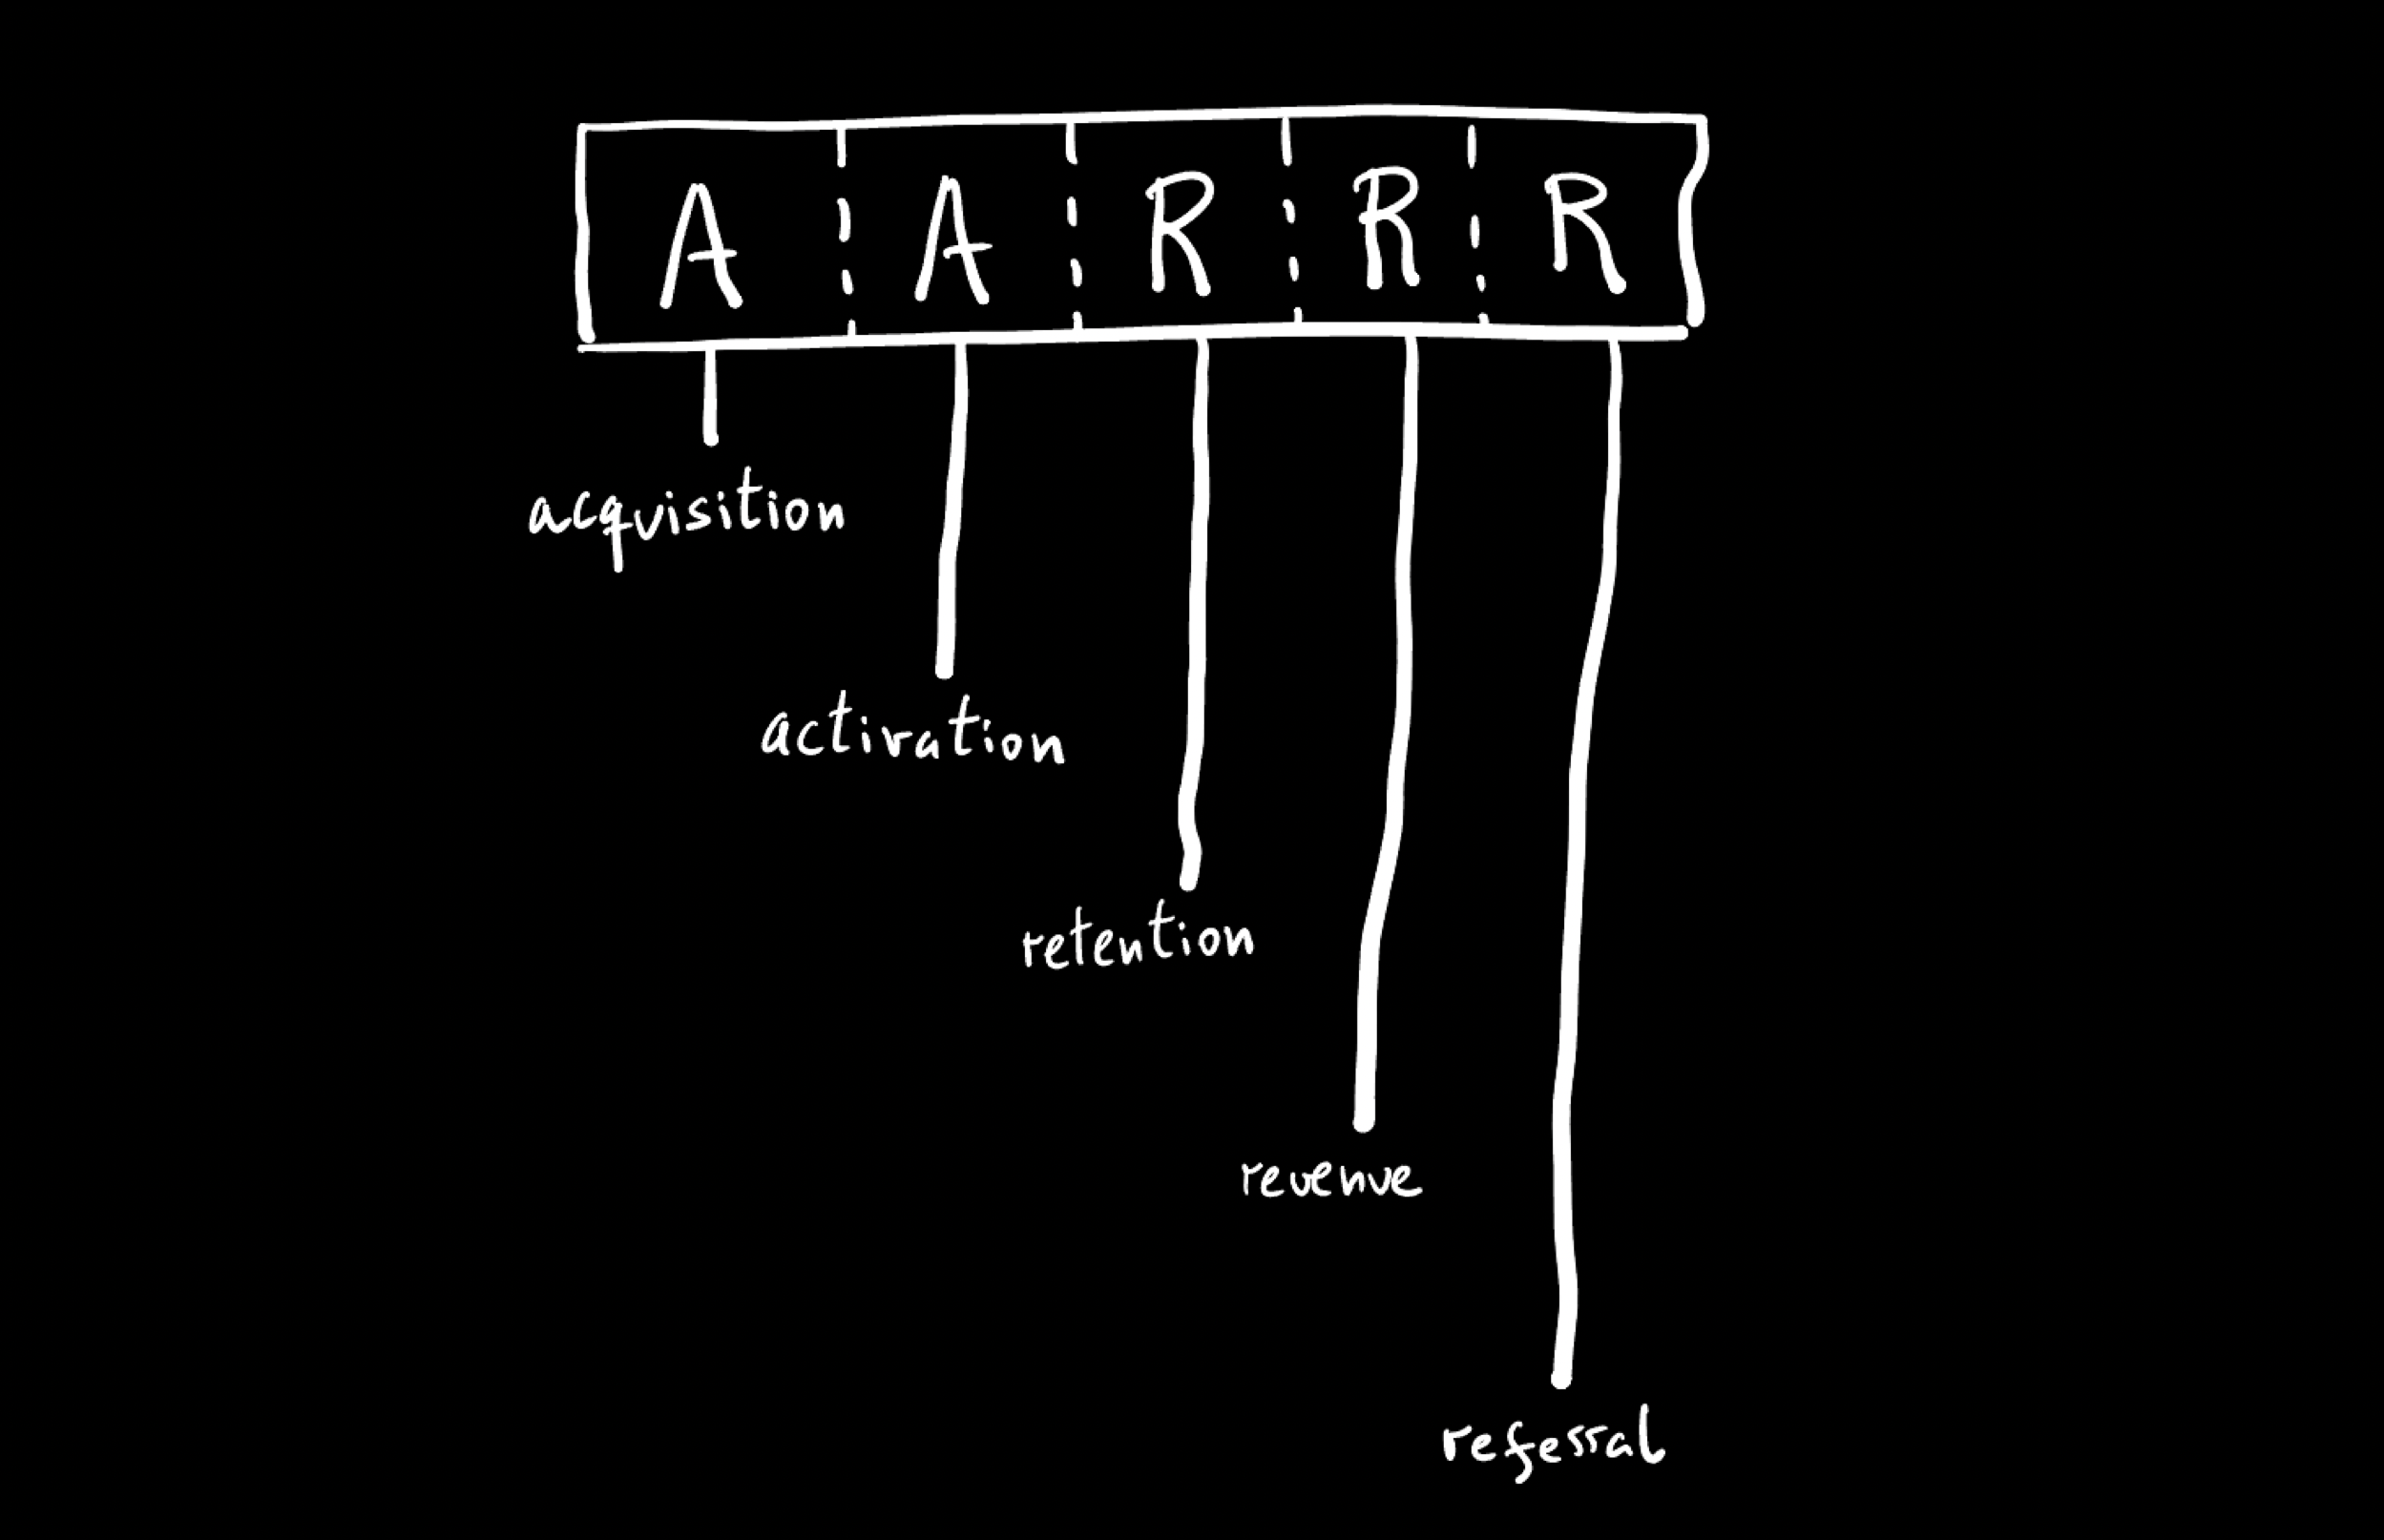
In the analytical current of product work it is often said that the main activity of your job in product management and development consists of NOT LYING TO YOURSELF. We devoted session 6 of the product management programme at Instituto Tramontana to thinking about behavioural and money metrics from that perspective.
To the extent that we are the kind of animal capable of creating virtual realities, as we saw in the previous session, we can do it with a better or worse fit — that is, drawing consequences that let us progress or that do not. The analytical current concentrates all its attention on metrics as a way of correcting those possible deviations when we project things. A metric, therefore, is understood as a way of reducing the risk implicit in any projection we make.
The metric arrives already stained
That said, producing metrics is not an exercise that can be done independently of the objectives we are pursuing. So to speak, the metric arrives already stained: we choose it because it fits something we already wanted to demonstrate, and the real order of operations is almost never the one recounted afterwards.
One way of correcting that underlying problem is to follow a set of criteria for establishing what a good metric is — as opposed to a metric that is good, which is a different matter — and in our case we articulated them around five aspects. The analytical current tends to formulate them with slightly different vocabularies, but they point to the same things: that it be comparable, so it can be situated in time or between segments; that it be understandable, because a metric that needs explaining does not get used; that it be expressed as a proportion or ratio, so growth is not confused with accumulation; that it change the behaviour of whoever looks at it, because if nothing gets decided differently it is not a metric but an ornament; and that it be auditable, meaning someone can reconstruct how it was calculated.
We also reflected on how the analytical current aspires to arrive at what is usually called the One Metric That Matters (OMTM), and debated the risks that approach can carry. The biggest one: ending up working to improve YOUR objectives without improving service to the customer.
This is worth stating more precisely, because the problem is structural rather than a matter of intent. The moment a measure becomes the criterion by which people are evaluated, it stops measuring what it measured and starts measuring the effort to move it. The virtue of the OMTM — concentrating an entire organisation's attention on a single number — is also its failure mechanism, because it concentrates the incentives just as effectively. A sufficiently competent team can move almost any metric without having improved anything, and will do so in good faith if that is what is being asked.
Behavioural metrics and money metrics
We developed several aspects of behavioural metrics, always very important and especially decisive in products where market share still weighs more than the profit and loss account.

Behavioural metrics order the funnel; they say nothing about what each step costs.
But we also stopped to analyse several peculiarities around money. The relationship with money tends to be quite curious in digital businesses: we can talk about it a great deal for certain topics — funding rounds, salaries — and not mention it at all for others, such as the limits on what we can do or how much runway the company has left. There is something there suggesting it is worth digging a little. In this session we spoke of "money" in relation to metrics, and not only of "business", precisely to underline that slippery aspect.
It helps first to think about how we relate day to day with the two main spheres in which money intervenes in companies: financial metrics and business metrics. In a product leadership position it matters to understand both and to choose the ones that give the most information for making decisions. They are not interchangeable: financial metrics describe the company as an economic entity, and business metrics describe the mechanism by which the product produces money. A product function that handles only the second can optimise the mechanism while the entity bleeds out.
Profitability could be the OMTM when we talk about money. The two main forces composing it are the money you have to deploy to set the business in motion — from building the product to acquiring customers — and the money you obtain in return, from margin to revenue per customer.
Sometimes the route to profitability is neither short nor straight. The companies that have ended up being called round-dependent need continuous funding, and that sometimes pushes the route into the background or loses it completely. When you direct product, this aspect determines the sense and function of the decisions you make: in a company whose next round depends on a growth curve, product decisions that improve margin can be literally counterproductive, and it is better to know that beforehand than to discover it.
Understanding the business model the product rests on is necessary to understand that route to profitability, and also to choose the relevant metrics and the levers that can improve them.
We live in the music of money, but not always in the lyrics
It is very common to hear about money all the time. Not always in the right direction.
We hear constantly about the rounds certain companies raise. Also about the salaries some are prepared to pay for the best teams. And yet the numbers of the companies we work in are often conjecture, when they are not simply unknown. In product this easily leads to making decisions without incorporating the money dimension. It may sound very odd written down, but this question frequently has no answer: how much money do we make with the product?

With money we tend to peer out from behind the wall: however you look at it, it stays inside a closed box.
There are at least three dimensions that make our relationship with money, and therefore decisions resting on it, complex:
- Transparency: data related to money tends to be concealed. Think about your own working experience and you will find it is very common for a company's financial side not to be shared; or to be shared selectively; or to be shared in a language that ensures it has no effect.
- Load: money carries a psychological weight. It generates worry and can produce outright blockages.
- Meta-thinking: with money, one of the first things that happens is that we tend to think about what the other person will think. If a CEO is about to share financial data about the cash left in the bank, the first thing triggered is a thought about the thought this will trigger in everyone else. That meta-thinking is frequently the very root of concealing the information.
The three reinforce each other, and the combination produces a rather paradoxical result: the information that most determines product decisions is the information that circulates worst. Not through bad faith, but because every link in the chain has a reasonable-sounding reason to hold it back a little.
Unit economics are the main indicators
If we manage to clear those barriers — and even if we do not, at least to acquire a better financial education — it matters to incorporate the thinking of what are known as unit economics. They have the characteristic beauty of something trivial and enormously useful.
They show us the comparison of revenue and cost. In that sense one could say old wine in a new bottle: they add nothing substantial to what financial thinking already did, but by concentrating on the unit — of product and of customer — they make everything more operational and actionable. That shift from the aggregate to the unit is precisely what makes them useful in product, because product decisions are always made about units: a feature, a segment, a signup flow.
To understand and organise unit economics you first need to know which kind of business model you are operating in. The business model is also the compass for orienting actions with respect to features, so it is something you always have to return to. Hybrids of pure models are quite common, and those hybrids are where metrics inherited from a textbook go most badly wrong.

The session's case study: calculating LTV with the data that actually exists, not the data you would need.
The two main forces in that revenue-and-cost comparison are CAC and LTV. The first tells you the cost you have to bear to acquire customers. The second, the revenue each customer leaves. Both make sense when viewed over time: at 1 year, at 2 years, at 3 years. And they serve equally to analyse what has happened and to project what you calculate will happen.
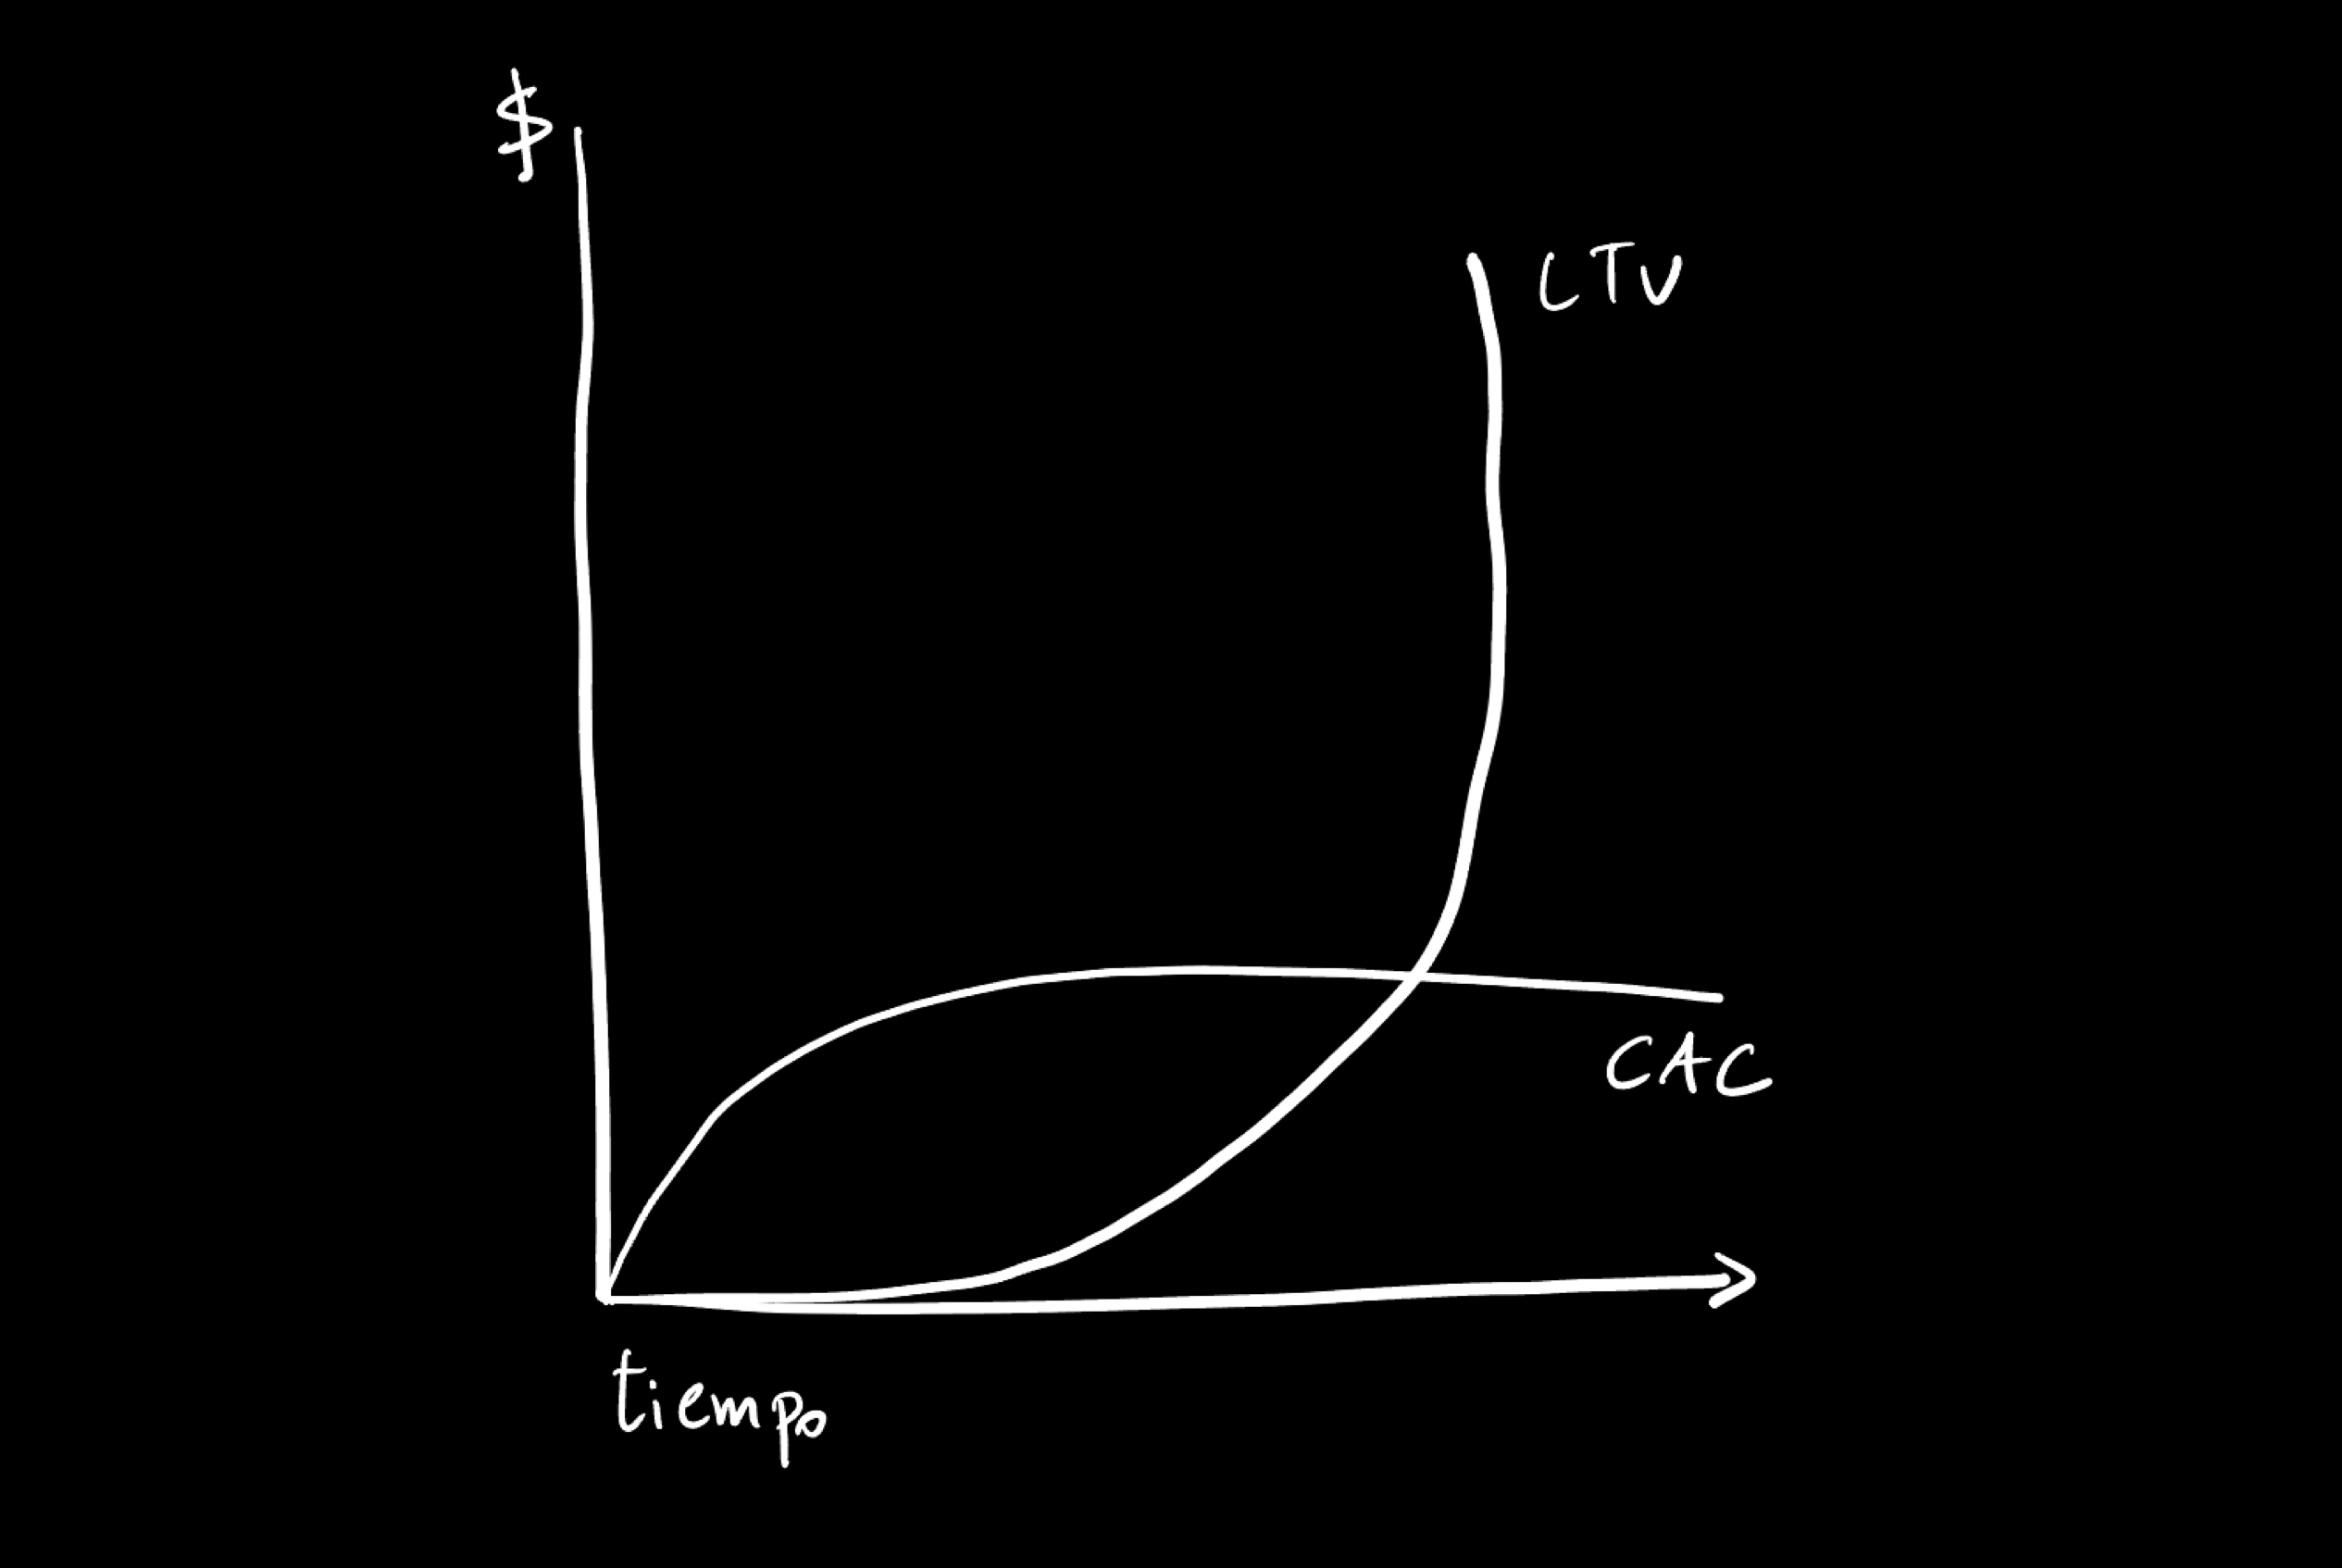
Where the two curves cross is the moment a customer starts returning what it cost to bring them in.
One final warning about them is warranted, because their apparent simplicity is deceptive. LTV incorporates a prediction about how long a customer will stay, and that prediction is the fragile part of the whole operation: calculated from a young cohort, it produces optimistic figures that justify any acquisition spend. Unit economics are not a source of truth. They are an instrument for making explicit the conjectures you were already making without saying so.
Could you say today, without asking anyone, what a customer of the product you direct costs and what they leave behind?