Favour thinking with metrics
Many companies whose business is a digital product act innumerately: how to escape that trap without mistaking thinking in quantities for thinking exactly.
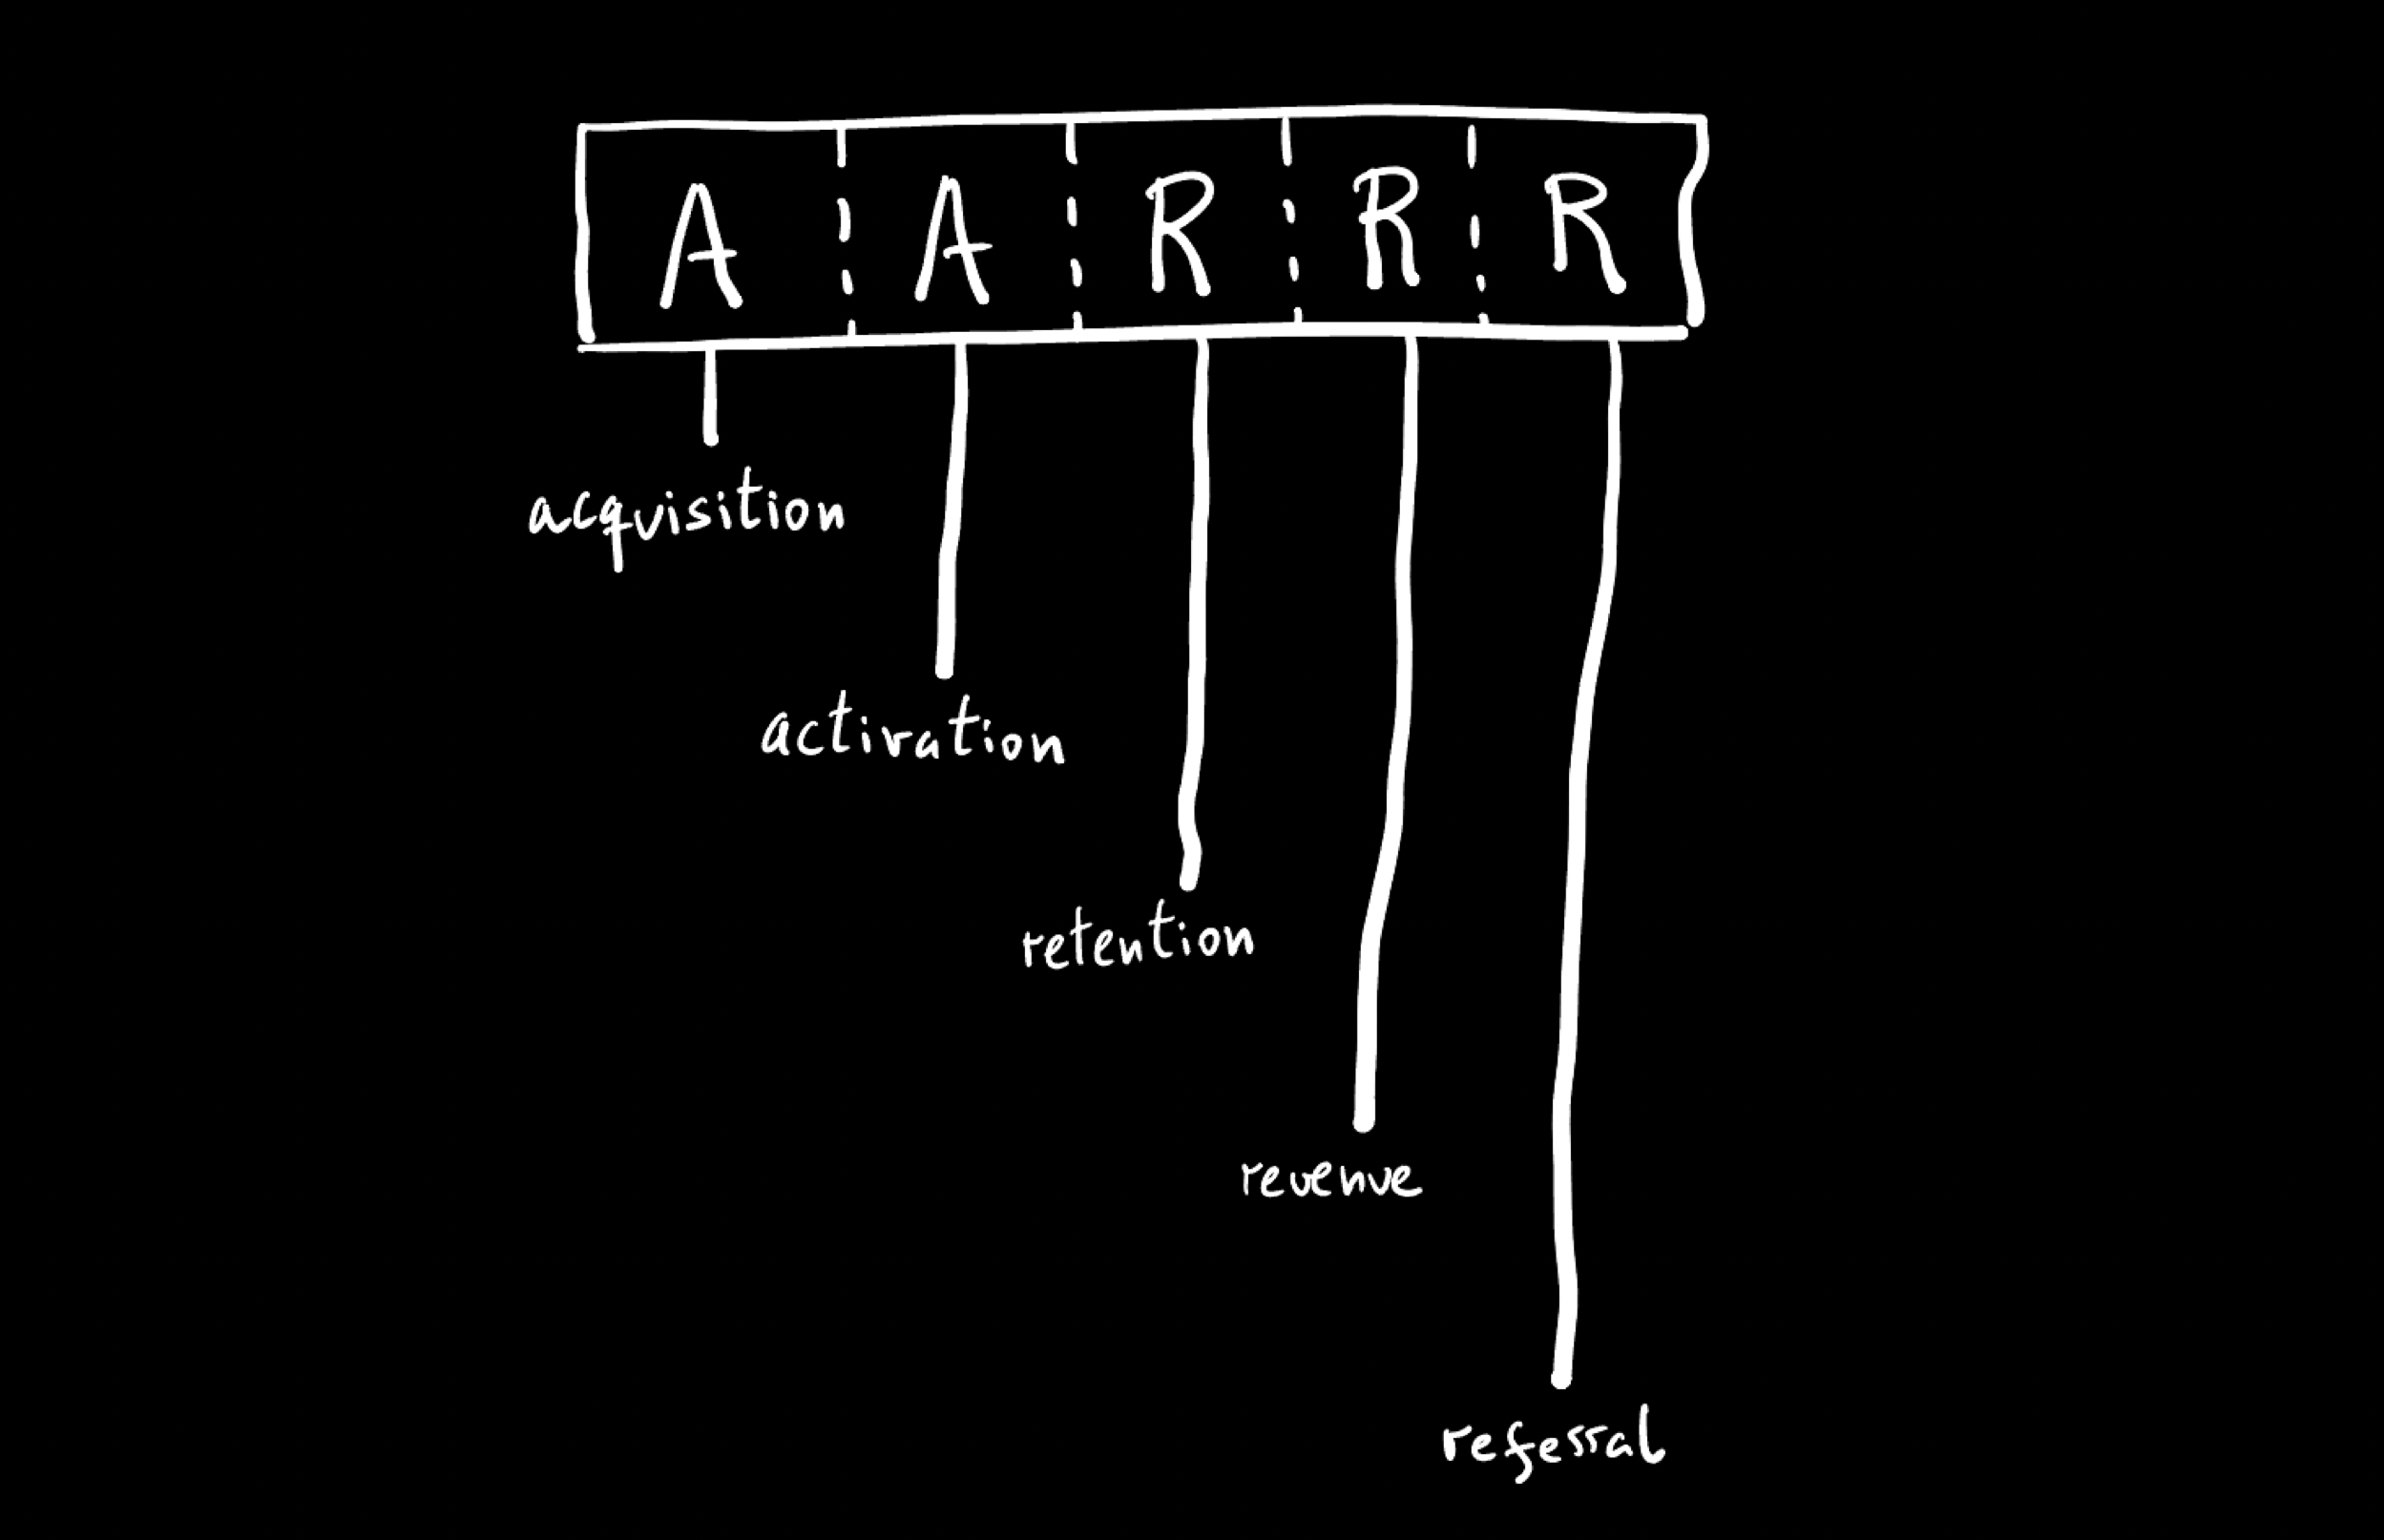
At Instituto Tramontana we used to open the doors every couple of months with sessions where you could experience the product management programme in miniature. On one hand I would walk through what was happening in the current edition: the contents, the people taking it, the battery of exercises and case studies. On the other I ran a kind of abbreviated simulation of a class, so that the dynamic of debate and reflection running through the whole programme could be understood while we were doing it.
In one of those sessions I was lucky enough to have a good number of people interested in widening their perspective on digital product and metrics. What follows are the notes from that session, which remains, I think, one of the subjects where our industry has the most room and the least habit.

Instituto Tramontana's open sessions worked as a miniature version of the programme.
Innumerate organisations
The nature of software gives the quantitative a special connotation. This explains why it is common for many companies whose business runs through a digital product to think and act innumerately.
John Allen Paulos popularised the term with his book Innumeracy: Mathematical Illiteracy and its Consequences, published in Spanish as El hombre anumérico. Perhaps as a way of joining a tradition of works as significant as Johan Huizinga's Homo ludens, Max Frisch's Homo faber, Viktor Frankl's Man's Search for Meaning, Robert Musil's The Man Without Qualities, or Gilbert Keith Chesterton's The Common Man.
There is a paradox in calling innumerate an industry that produces more data than any other in history. But innumeracy does not consist of having no numbers: it consists of being unable to do anything with them. An organisation can have dashboards on every screen and still decide by anecdote, by hierarchy, or by analogy with what some other company did. In fact, that is a fairly frequent outcome: the dashboards work as an alibi, not as an instrument.

One of the most opaque boxes in any organisation is money: much talked about, seldom measured.
We often confuse quantitative thinking with exact thinking. They are different things, almost opposite in spirit. Exact thinking looks for the correct figure; quantitative thinking looks for the order of magnitude, the proportion, the relative position within a range. The first feels more rigorous and tends to be more fragile, because a specific figure with no scale admits neither discussion nor correction: it only admits being believed or not.
The quantitative in digital
During the session I brought along some ordinary empirical material, things that had just happened in my working environments. That is, experiences anyone has frequently. Through those anecdotes we could see some of the challenges digital throws at us when we try to get out of the innumerate trap.
The first is that finding the signal in the noise is not trivial. All the information we have to digest is noise until we find in it some signal that either helps us articulate the information or helps us draw a consequence to orient our action. The information we have to handle grows in a far greater proportion than the signal we can find in it, and it is shifting, systemic, and full of uncertain elements, which makes working with it anything but easy.
Here is a first warning: do not always assume more information is better. Be prudent when facing a data instrumentation project, because it is easy to run aground in one. Digital has an organic behaviour that is hard to control, and instrumentation grows with the same exuberance as the rest of the system.
The second is that in your digital product, data sources will always be under suspicion. They, and the concepts — therefore the models — built on top of them. There is no data without interpretation. An event does not record what someone did: it records what someone decided, months ago and with different questions in mind, was worth recording. Even the most obvious indicators hide a great deal of complexity, and you only need to ask in a meeting what exactly counts as an "active user" for three incompatible definitions to surface that had been coexisting peacefully for years.
This leads to a habitual sense of distrust that has to be handled. The mature response is not to resolve it — it does not resolve — but to administer it: to know which source you distrust and by how much, and to decide accordingly.
The third is that behavioural analytics is especially demanding. What we usually call product analytics forces us to make conjectures about the intent behind what people — or whatever entity sits on the other side of the screen — do, based on their attributes, that is, on events. We are inferring motives from traces. Often the qualitative, the empathy that lets you talk to them, works as an anchor that reduces that noise. Not as an alternative source of truth, but as the mechanism that tells you which hypothesis is worth looking for in the data.
Another crucial aspect of working with statistical notions is the sample. It matters especially in capturing problems and opportunities, which is often done from anchors, whether through surveys or sampling processes. The two most important characteristics of a sample, when evaluating what we can infer from it, are representativeness — signal relative to the rest — and variability — signal relative to another sample. Five customer conversations can be plenty or completely useless, and the difference is not the number but how they were chosen.

Working a use case in session: calculating LTV forces you to put numbers where intuitions used to be.
Metrics as a compass
After going through several of these challenges, we had the chance to debate — while exercising our numerical muscles — some of the benefits of statistical instruments, even in their most elementary form. It matters to include them as one more force in the gravitational field of your decisions. I developed this in more detail when writing about favouring statistical thinking, but the points that generated the most discussion are worth collecting here.
First, you cannot draw progressively better-fitting consequences unless you test your intuitions against the statistical references available to you. You can think of it this way: every time you obtain better references, what you are doing is widening your sample relative to the whole population.
Statistics also let us apply a simple but powerful operation: starting to group things relative to the whole. We can establish a correspondence between statistics and segments, and from there start thinking about every element of a product from a multidimensional view, and about features by dimension.
Thinking in inexact numbers is the best way to accustom your senses to the magnitudes you work with. Exact numbers are convenient for objectives; magnitudes are convenient for framing possible initiatives. Thinking in magnitudes puts you in the territory of relative measures, which is where a conjecture can begin. Exact numbers in a vacuum mean nothing: once you place them on a scale and in relation to other points on that scale, they become interesting and can be the start of some action.
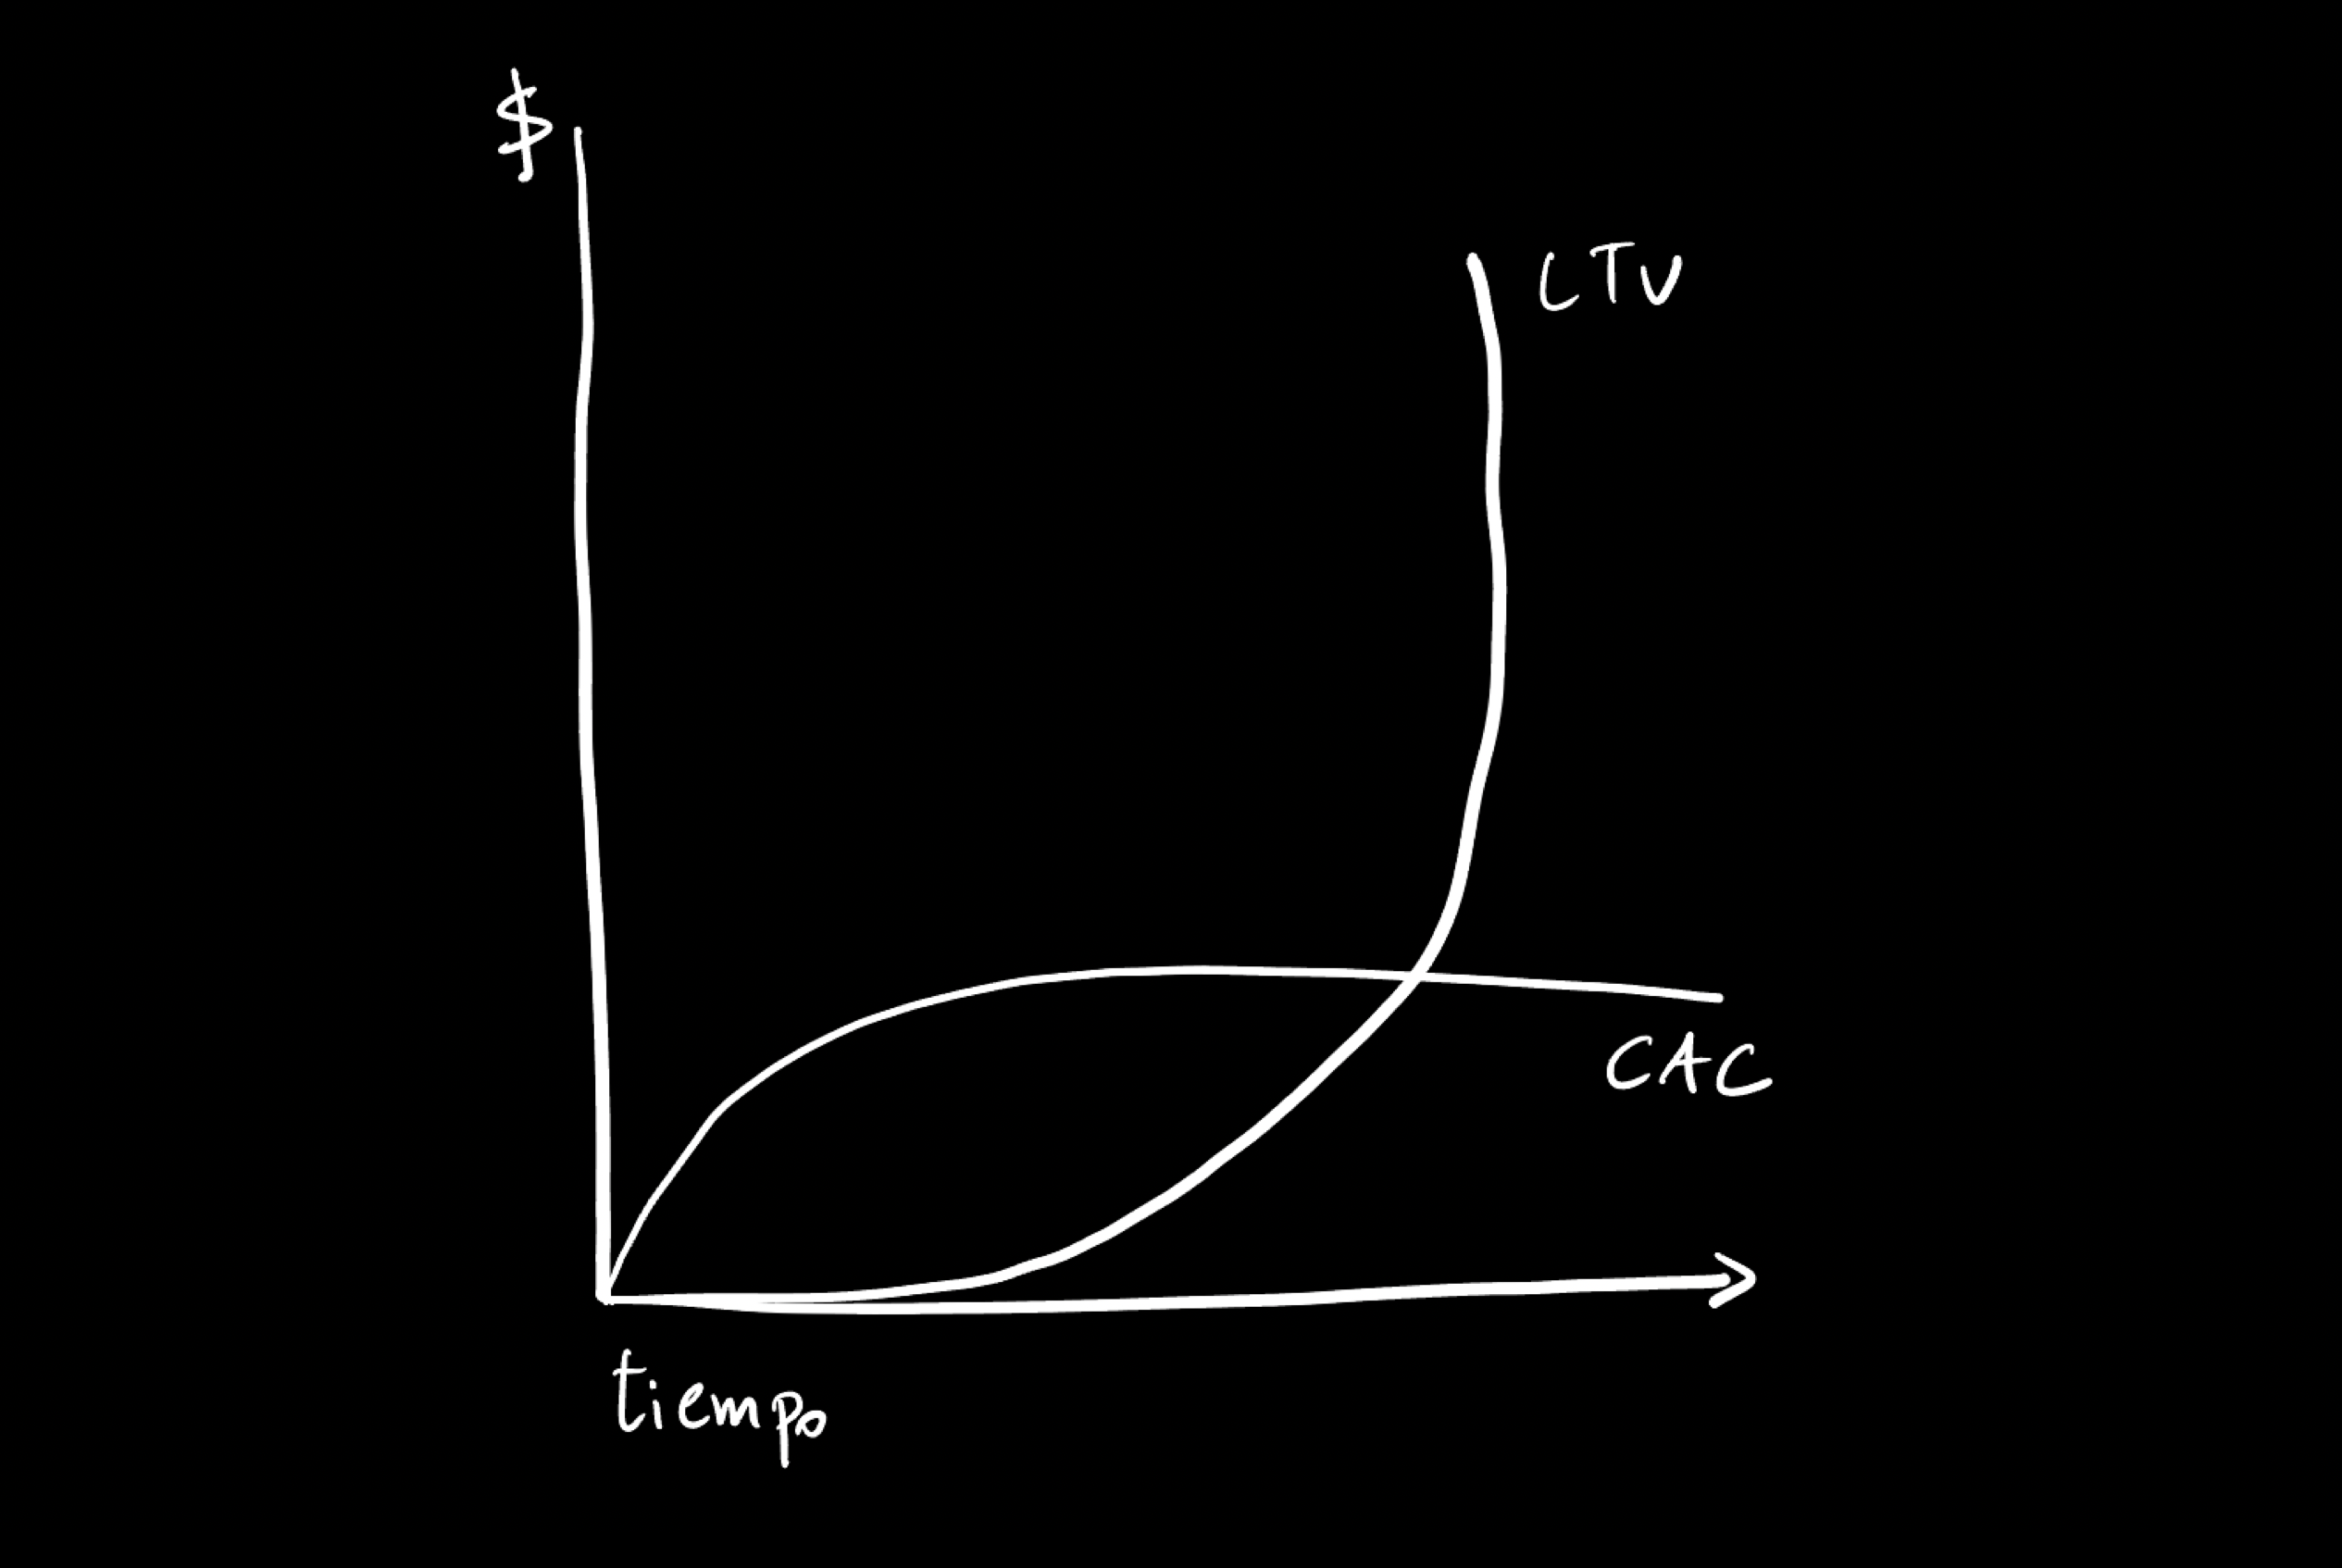
CAC and LTV only make sense viewed over time. The magnitude matters more than the figure.
You will frequently face actions and objectives that are not contextualised — that is, that have no scale and no relative reference. Quantifying lets you start dismantling that first obstacle, establishing a confidence level and from there some probability, even an intuited one.
Finally, it is healthy to see the quantitative as a way of discovering and not only as a way of predicting. Reaching causality, and with it prediction, cannot be your first objective when working with statistical references. The first benefit is usually being able to discover things that were otherwise simply unknown unknowns. In that sense, statistical thinking is a useful tool for understanding and finding potential improvements that would otherwise stay hidden.
Metrics are compasses that indicate direction, not an exact destination. It is a distinction that looks minor and decides quite a lot: a compass lets you correct course while walking; an exact destination lets you justify why you never arrived.
What we take away is that the spirit running through all this can help professionalise our organisations and teams. Complex environments — and we already know that the oil stain of software makes everything especially complex — reformulate how we understand and work with the quantitative. H.G. Wells wrote that statistical thinking would one day be as necessary for efficient citizenship as the ability to read and write. It does not look like we have satisfied that prophecy yet, and certainly not in the industry that produces the most data.